Mapping God’s Bloodline
Follow the genealogy of Jesus from the creation of Adam and Eve through Noah, the tribes of Israel, King David, and finally Joseph and Mary.
Viz.Bible Vision on The Digital Ministry Podcast
Explore the concept of a minister of data and how visualizing data can inspire and educate the church community. Dive into the future of technology, including AI and contextual databases, and their potential in shaping the ministry.
Old Testament Prophecies Fulfilled in Christ
This visualization by Christian Felix and Kevin Flerlage maps 44 Old Testament Prophecies about Christ to their New Testament fulfillment, grouped by categories…
The Timeline of Acts with People and Chapters
Timelines are designed to answer two basic questions: What happened? When did it happen? This timeline aligns events in the book of Acts…
Isaiah 9:6 Interactive Art (Guest Post)
Emily Law noticed how a canvas on a wall is observed but not interacted with; it lacks sensorial engagement. Her creation starts with…
Machine Learning, AI, and Bible Data Project List
A list of Bible-related projects using natural language processing, image recognition, or advanced data processing.
Why Bibles Should Have Ancestry Charts
Every Bible has maps in the back, but not a chart of the genealogy of Jesus. Bibles had it in 1611…why not today? Maybe it’s time for a comeback. People care about people, and we should make charts that tell their story.
Envisioning the Next Phase of Bible Applications
What if the Apostle Paul had a Facebook profile page? Facebook uses their social graph to understand people’s relationships and experiences. Google organizes…
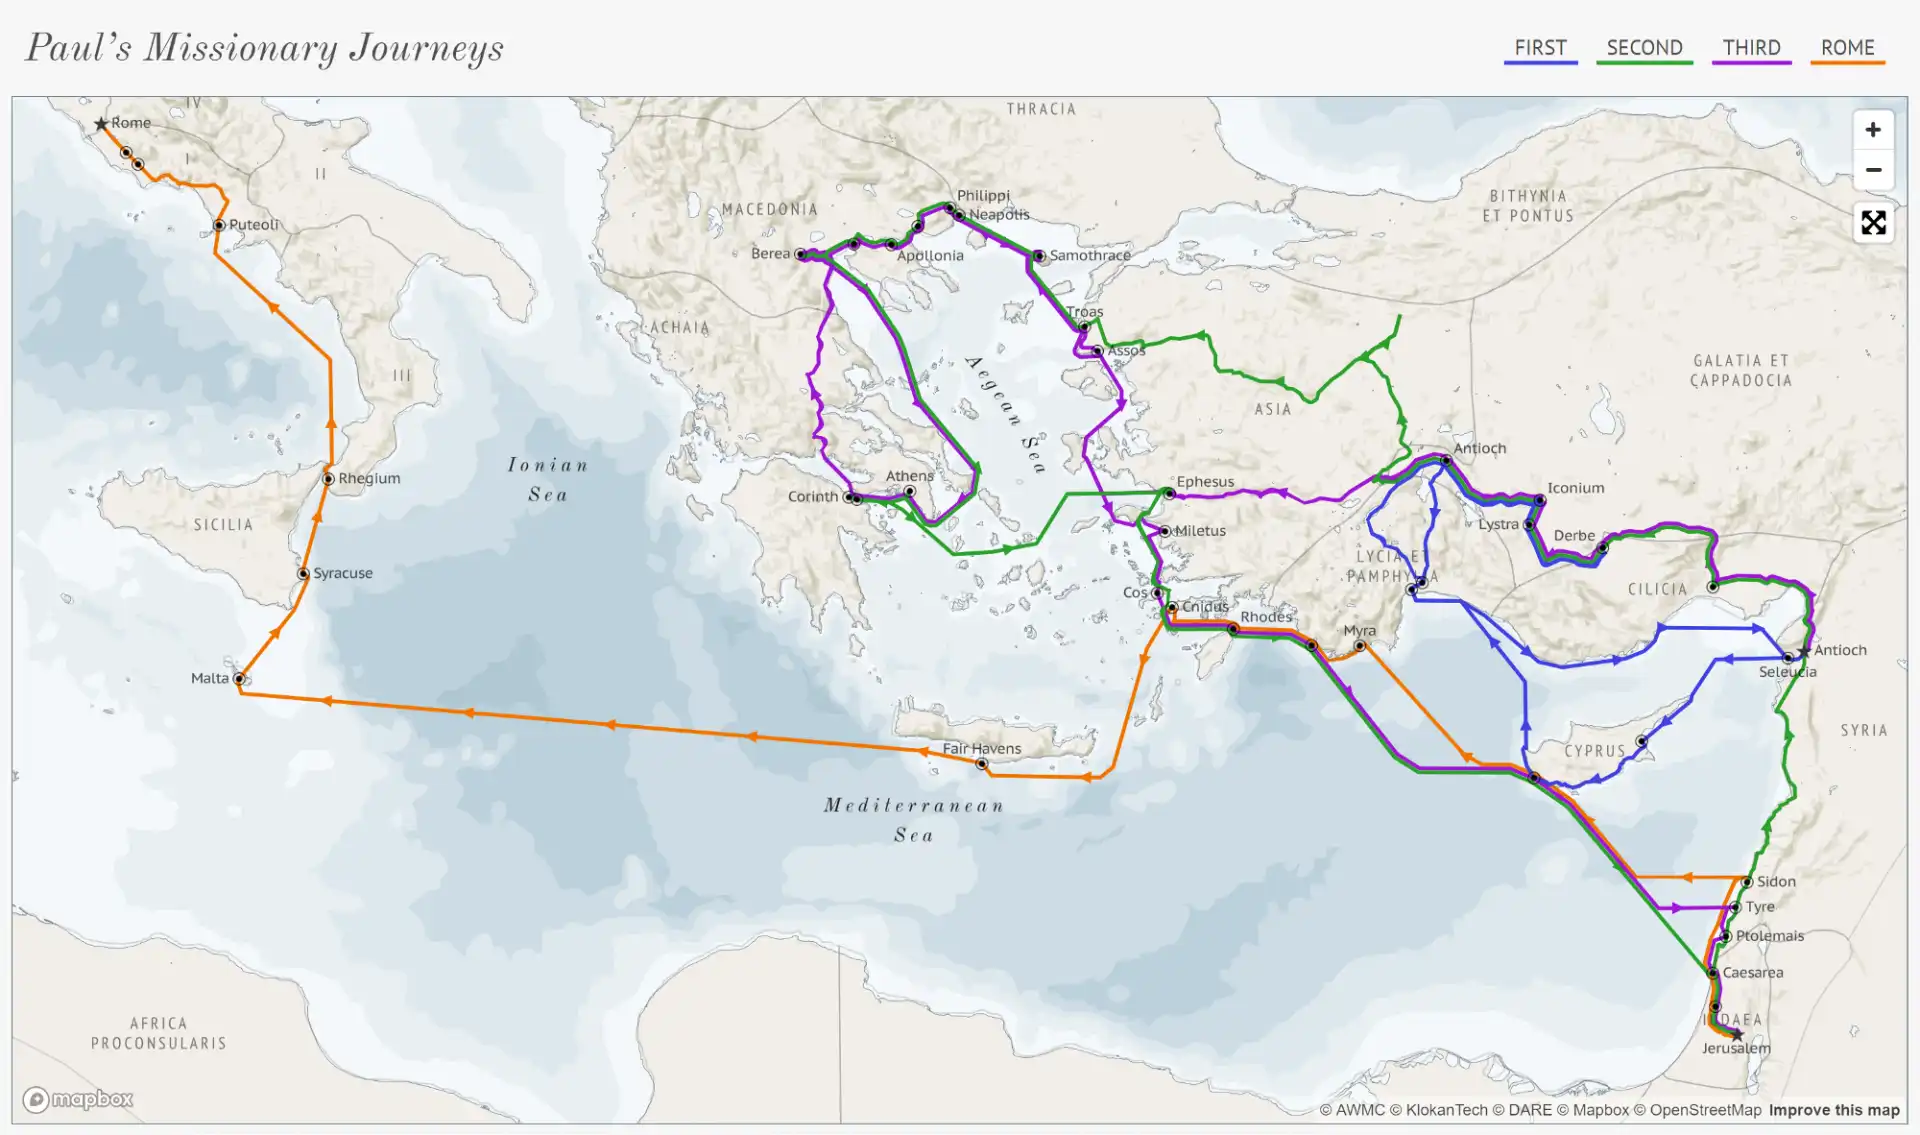
A New Map of Paul’s Missionary Journeys
A new map of Paul's Missionary Journeys upgrades from print-based paradigms with an interactive interface overlaid on the roads, provinces, and cities of…
Upgrades to Skills, Speed, and Searching
Updates including with mobile-friendly views, improved loading performance, a new map style, and expanded search capabilities. Plus, see what project is next on…
My Bible Technology Wish List
Nearly every week I dream of new ways to communicate scripture in a digital world. Ideas pile up in my notebooks and spreadsheets…
A Visual Harmony of the Gospels
The four Gospels each have a unique emphasis on Jesus’ time and teachings. A typical harmony of the Gospels lays out all the…
Who was Alive in Jesus’ Day?
Who was alive at the same time as Jesus? This visualization, part of #MakeoverMonday, zooms in on that period using biographical data of…
Who Wrote Each Book and Chapter of the Bible?
I had to make several decisions while collecting and structuring the files on this site. What data should I include? How should it…
Using Visual Thinking to Study and Remember Text
Pictures are easier to process and recall than words. We usually don't remember every detail, but the main subjects are clear.
Colorful Language in the Bible
Good stories include vibrant imagery helping our imagination recreate the scene as we read or listen. Our senses are invoked with familiar and…
Remaking An Influential Cross Reference Visualization
When I first began exploring the subject of data visualization, I had no idea how much one piece of data-driven artwork could inspire…
The History and Popularity of English Bible Translations
There was a time when no one could read the Bible in their own language.Wycliffe Global Alliance statistics show that most of the…
Visualizing the Genesis Timeline from Adam to Abraham
I have previously showed how a network diagram plotting biblical genealogies can help us follow what would otherwise be a very monotonous section…
What Does Data Visualization Have to do with Bible Study?
We don't normally associate the term "data" with holy texts. We see the Bible as a collection of stories. We see data as…
Sentiment Analysis of Biblical People
Market researchers routinely use sentiment analysis to gauge overall perceptions of what they're selling. Data comes in from social media, customer feedback, and…
The Trinity in QR Code
Zoomable codes within a code serve as a dense metaphor about the nature of God, beginning with the persons of the Trinity and revealing more detail as one looks closer. Each small square encodes text describing the Godhead, combining to return the names God, Father, Son and Holy Spirit.
The Groundbreaking Achievement of Clarence Larkin
Clarence Larkin’s illustrations on the Book of Revelation and Daniel’s vision stand out among his many books and illustrations as a model for us to follow.


](/static/b80f1fa5b7537e3e3a0e325e9525e8d6/3e9e3/Isaiah_9-6_Art__Data.png)


